
The CFO’s 10-Point Checklist for AI & GTM Tech Consolidation

The CFO’s 10-Point Checklist for AI & GTM Tech Stack Consolidation
A CFO and CRO Guide to Reducing SaaS Spend, Eliminating Tool Sprawl, and Building the Business Case for AI Consolidation. AI has made the modern go-to-market (GTM) technology stack more powerful - and undeniably chaotic.
Sales, marketing, RevOps, customer success, and finance teams now manage a labyrinth of CRM platforms, sales engagement tools, conversation intelligence, intent data, lead enrichment software, AI copilots, and predictive analytics.
The underlying problem isn’t just having too many software applications. The real culprit is GTM tech stack sprawl: overlapping features, fragmented customer data, duplicated AI capabilities, unused SaaS licenses, fragile integrations, and ballooning administrative costs. For CFOs, this creates a major financial trap: the total cost of technology is vastly higher than your software invoices suggest.
For CROs and RevOps leaders, the penalty shows up in daily execution. Reps waste hours context-switching between tools, customer data becomes inconsistent, workflows break, adoption plummets, and AI tools end up making decisions based on incomplete context. This is why AI tech consolidation and GTM stack rationalization have become top strategic priorities. The objective isn't merely cutting vendor costs - it is building a leaner, interconnected, higher-ROI revenue engine.
Why CFOs Are Re-Evaluating GTM Tech Stacks
Identify a problem → Buy a point solution → Integrate it → Train users → Repeat.
Over time, this incremental buying pattern breeds massive tool sprawl. A typical modern revenue organization often ends up running separate platforms for:
CRM & Customer Data: Central source of truth for accounts.
Data & Enrichment: Intent data, lead enrichment, and data hygiene tools.
Execution & Automation: Sales engagement, marketing automation, and workflow tools.
Intelligence & Analytics: Conversation intelligence, forecasting, and pipeline analytics.
AI Layer: Point-solution AI copilots, automated agents, and reporting tools.
When multiple tools solve overlapping problems while demanding independent contracts, integrations, security reviews, and training protocols, financial leakages compound. CFOs must evaluate technology rationalization, not just software line items.
What Is GTM Tech Stack Sprawl?
GTM tool sprawl occurs when an enterprise acquires more revenue technology than its teams can efficiently operationalize.
Common warning signs include:
Multiple tools performing identical core functions.
Low software adoption and high rates of "shelfware."
Duplicate customer records and conflicting metrics across systems.
Heavy reliance on manual data entry and spreadsheet workarounds.
Ballooning middleware, API, and RevOps administration costs.
Siloed AI implementations operating without unified customer context.
This results in a heavy "sprawl tax"—wasted capital, lost employee productivity, poor data quality, and operational drag.

The CFO's 10-Point AI & GTM Consolidation Checklist
Before approving your next SaaS or AI software purchase, evaluate your environment using this 10-point framework.
1. Calculate Total Cost of Ownership (TCO)—Not Just License Fees
The software invoice represents only a fraction of total costs. True SaaS TCO includes:
Software licenses and seat additions
Implementation, onboarding, and professional services
Integration maintenance, API usage, and middleware costs
Data storage and enrichment fees
Internal RevOps, engineering, and admin hours
Security, compliance, and ongoing vendor management reviews
The CFO Question: What does this capability cost annually when software, internal labor, integrations, and administration are fully loaded?
2. Map Feature and AI Capability Overlap
AI capabilities are proliferating rapidly across existing point solutions. Multiple tools in your current stack likely offer duplicate features such as:
Lead and account scoring
Conversational analysis and call summaries
Data enrichment and intent detection
Automated email generation and pipeline recommendations
Map out each capability by tool, annual cost, usage frequency, and business outcome to uncover redundancy.
3. Quantify Integration and Data-Flow Friction
Every integration introduces operational risk and maintenance overhead. Schema updates, API rate limits, and broken syncs cost developer time and degrade data quality.
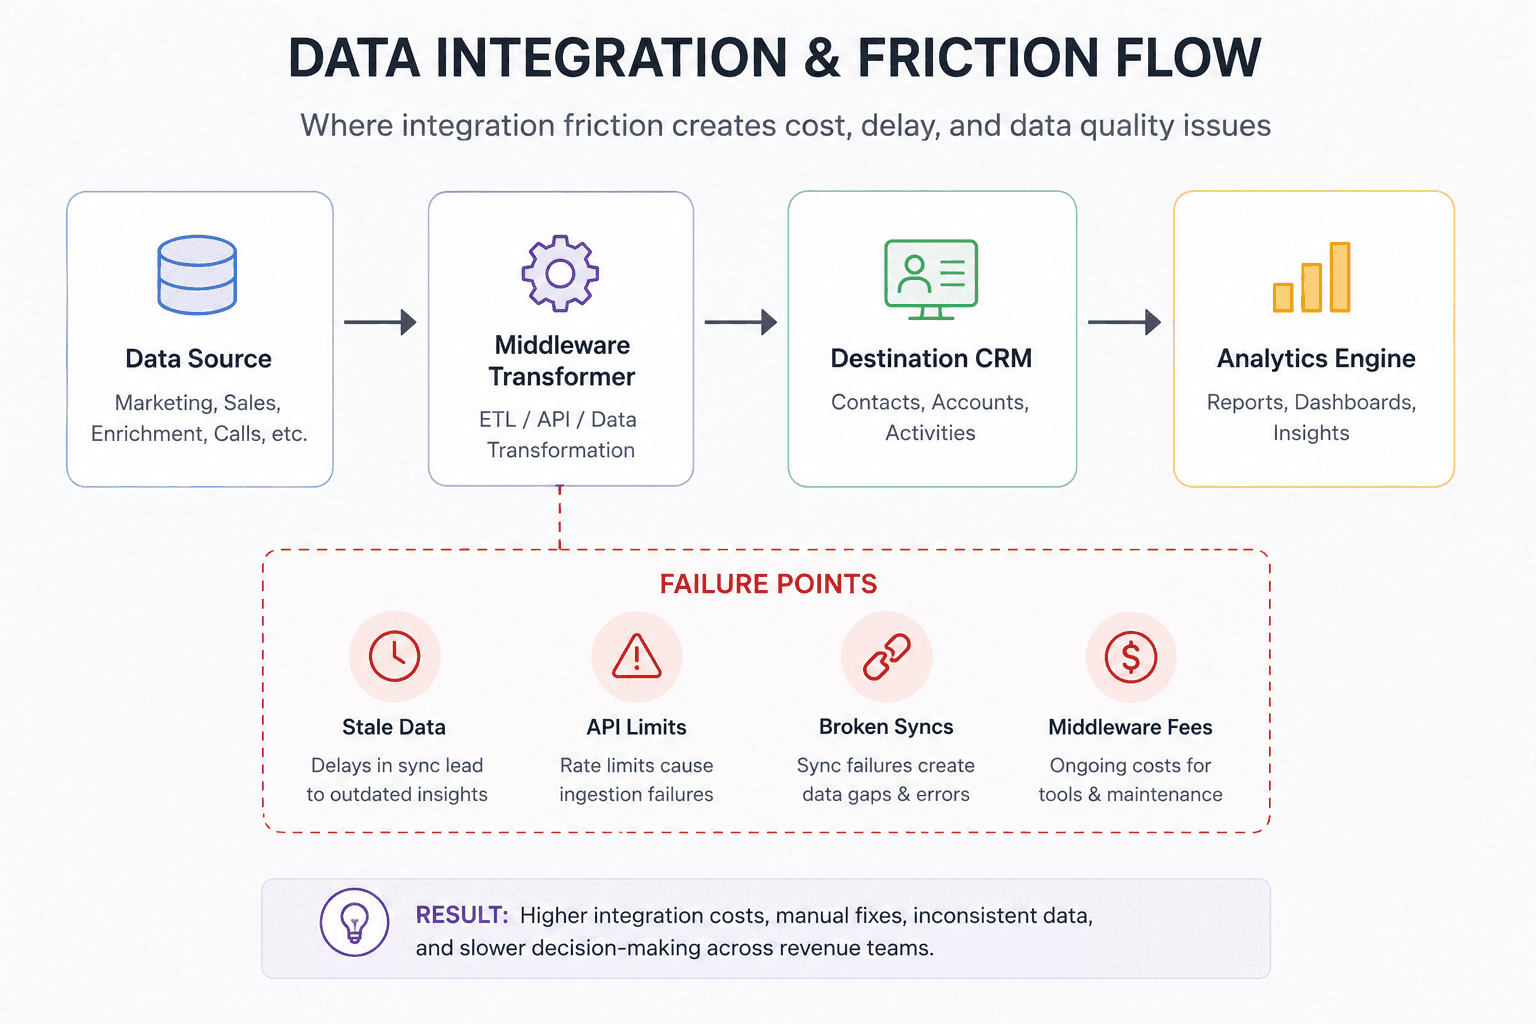
The CFO Question: How much internal resource is spent simply keeping our disparate systems connected and synchronized?
4. Evaluate Time-to-Value and Deployment Lag
A technology investment should be judged by how quickly it yields measurable return. Track the complete timeline:
Deployment Journey: Contract Signed → Setup & Integration → User Training → Active Adoption → Measurable Business Impact
A platform that achieves operational status within weeks yields a radically different ROI profile compared to point solutions requiring multi-month deployment cycles.
5. Measure Data Fragmentation and AI Accuracy Risk
AI models require unified, high-quality context to generate accurate recommendations. Fragmenting customer interactions across disparate databases leads to bad inferences in lead routing, forecasting, churn prediction, and pipeline prioritization.
The CFO Question: Are key revenue decisions being made using partial context from disconnected tools?
6. Review Vendor Risk, Compliance, and AI Governance
Each added vendor expands your risk landscape. Review vendor concentration, renewal timelines, security compliance (SOC 2, GDPR), data processing agreements, and data usage policies for machine learning models.
Governance Check: Where is sensitive customer data being processed, and which third-party AI vendors have access to it?
7. Account for Hidden Internal Headcount Costs
Software platforms require dedicated management. Quantify the operational time spent administering each tool:
Headcount Cost Formula: Annual Admin Cost = Internal Admin Hours × Fully Loaded Hourly Rate
8. Audit SaaS Utilization and Eliminate Shelfware
Track active utilization against paid licenses:
Utilization Formula: Utilization Rate (%) = (Active Monthly Users ÷ Total Paid Licenses) × 100
Identify unused licenses ("shelfware") and legacy features that teams have bypassed.
9. Test Scalability and Future Tech Debt
Evaluate how your tech stack will handle scaling milestones (e.g., doubling headcount, launching new product lines, expanding geographies). A scalable consolidation platform should accommodate expansion without requiring new point solutions at every juncture.
10. Construct a CFO-Ready ROI and Payback Model
Consolidate your findings into a clean financial comparison framework:
Financial Metric | Calculation / Formula | Strategic Business Focus |
Annual Savings | Current TCO − Consolidated TCO | Net capital recovered annually by rationalizing software and admin costs. |
ROI (%) | [(Financial Benefits − Investment Cost) ÷ Investment Cost] × 100 | Quantifiable financial return relative to total consolidation expenditure. |
Payback Period | Implementation Investment ÷ Monthly Financial Benefits | Exact timeframe (in months) required to fully recover capital outlay. |
90-Day Consolidation Execution Roadmap
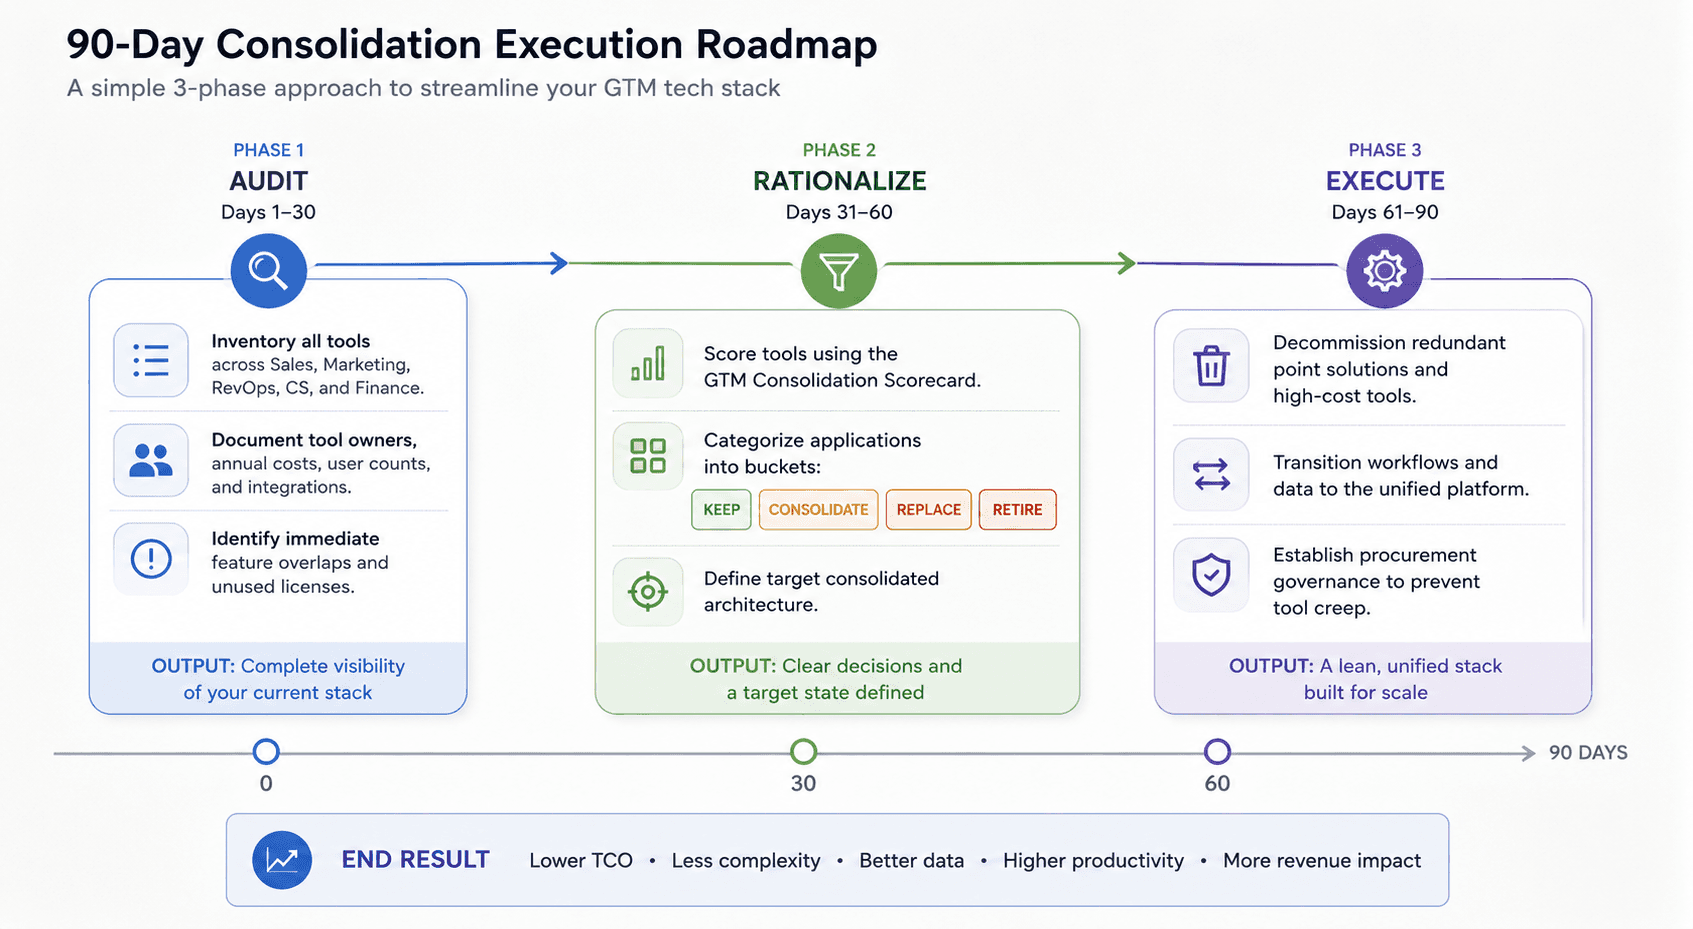
The GTM Technology Rationalization Scorecard
To keep software evaluations objective between Finance and RevOps, score each tool from 1 to 5 across weighted criteria:
Evaluation Criterion | Weight | Strategic Focus |
Business Impact & Value | 20% | Direct contribution to revenue generation or retention |
User Adoption & Engagement | 15% | Active monthly usage vs. paid capacity |
Cost Efficiency & Licensing | 15% | Value relative to market alternatives |
Feature Redundancy | 15% | Degree of overlap with primary platforms |
Data Integrity & Quality | 10% | Reliability and consistency of output data |
Integration Complexity | 10% | Overhead required to maintain system connections |
Scalability & Architecture | 10% | Ability to support organizational growth |
Vendor Risk & Compliance | 5% | Security posture and vendor stability |
Key Considerations for Choosing a Consolidation Architecture
The objective of tech stack consolidation is not simply vendor bundling - it is eliminating unnecessary operational complexity.
When evaluating a unified revenue intelligence or GTM consolidation platform, prioritize solutions that offer:
Unified Data Core: Single repository for customer interactions, intent signals, and CRM records.
Native AI Context: Integrated intelligence that operates across the full customer lifecycle without external API hops.
Centralized Administration: Reduced overhead for security management, user provisioning, and analytics.
Workflow Continuity: Seamless handoffs between marketing, sales execution, and customer success teams.
By shifting from a fragmented point-solution model to an integrated architecture, organizations can systematically reduce financial waste, streamline RevOps administration, and improve revenue predictability.
Where DataviCloud Fits
Run your stack through these ten criteria and a pattern usually emerges fast: the overlap is bigger than anyone budgeted for, the admin burden is invisible until you add it up, and the tools you’re paying for individually are each doing a fraction of what one platform could do together.
DataviCloud was built to be the “one platform” answer to this exact checklist - not by bundling disconnected features under a single invoice, but by unifying the data layer that every AI capability in your GTM motion depends on. Lead scoring, forecasting, conversation intelligence, and enrichment all run on the same customer data model, which means:
No feature overlap : One AI engine powering every GTM function, not five vendors duplicating the same predictions on different data.
Lower integration overhead : A single data architecture eliminates the middleware and maintenance costs of stitching disparate tools together.
Faster time-to-value : One rollout, one admin console, one training curve instead of five.
Higher-fidelity AI : Predictions and recommendations run on a complete, unified data set instead of fragmented partial views.
Built to scale : New regions, products, or headcount don’t require new integrations or new vendor contracts.
For CROs building the case to their CFO, DataviCloud isn’t another line item to evaluate against this checklist - it’s the platform that makes most of these ten problems disappear at once, with a payback timeline finance can actually model.
Ready to Build Your Business Case?
Run your current stack through this checklist, then let’s talk about what consolidating onto DataviCloud does to your TCO, your team’s time, and your next board deck.
Take the Next Step
Schedule a consolidation ROI assessment →
Recent Post





FAQ
Comment Section